Desperately seeking Neurosurgery
Still Mostly Wrong


Just the other day, I bumped into someone in the corridor outside my office. A man with a limp. He was lost. I get this a lot—Neurosurgery is just around the corner. Their clinical offices are in an obscure nook near the Department of Critical Care Medicine. I bump into a lot of people looking for that too, because they were directed to “Ward 82”, which is the same thing—but you wouldn’t know it. Move a bit closer to the old lifts and take an unexpected right, and there’s Neurology Day Stay. You guessed it—people also wander into my domain looking for this. It’s just across from where Clinical Photography used to be.
As I was escorting him to Neurosurgery—directions are useless—I had a few thoughts. The first was that, in the increasingly unlikely case that I strike it rich someday, I’ll put aside some funds for the unfortunates who wait outside that ominous door, pondering their new and threatening diagnosis while a user-hostile plastic chair gnaws at their bottom. I’ll set aside a salubrious waiting area, with comfortable chairs, something interesting to read that avoids the topic of brain tumours, and a decent coffee machine. And clear signage. Perhaps there might even be a toaster. But I had a second thought too.
An idea. My theory fits the observed facts, but it’s a bit daft. Here it is, anyway: there’s a secret Guild of Hospital Architects that only reluctantly admits you beyond their obscure and hallowed portal—so obscure that it’s more well hidden than the Department of Neurosurgery. There are secret tests. Blood may be involved. Perhaps they’ve had DNA technology for far longer than anyone else, and will only admit those who have been convincingly shown to cherish within their chromosomes the genes of small burrowing animals? Or for full membership, you have to invent a new non-periodic tessellation, guaranteed to confuse the eye and mislead the mind. Surely this is a world-wide guild, because wherever I go, I almost never enter a hospital that makes complete sense. A hospital that is accessible, well laid out, and fully functional.
My theory is daft because there’s a simpler theory that does the job. It’s this: variation. Shit happens. Hospitals aren’t actually designed—they accrete. They are always in the process of being built, and so many random insults impinge upon this process that they are never built according to the original plan. Even if the original plan was coherent. The Guild is surely a figment of my imagination, and some hospital architects are likely sane, after all. Maybe. Mostly.
But let’s look within the facade. How do things run? And here’s the sad fact: wild variation happens there too. The processes that govern the function of hospitals also accreted. And then they mutated. And so they mislead and confuse. Sometimes you never find Neurosurgery. The real question for me is “Can we fix this?”
Yes. But also no. This post is an exploration of why things go wrong (especially in hospitals), how we can fix them with knowledge we’ve had for a century now, and why we still don’t. To understand at all, we’ll have to go back a bit. As I promised, we’ll go back to …
Cicero, Illinois; 16 May 1924
As with all good science, it started with a problem. The problem here was that the quality of the products at Bell Telephone varied rather a lot. For example, the carbon transmitters in their telephone handsets varied—and therefore, so did the voice quality you heard at the other end.1
And Walter A Shewhart has just worked out a one-page solution. Yeah, lots of people have solutions, but this one actually works. It still does in 2025. Let’s find out why.
The traditional approach to “fixing bad quality”—still employed in Hospitals around the world—is simple. There are 3 steps:
Mass inspect everything
Shout at everyone if things are wrong
Send the defective things back to be fixed.
There is a better way. It involves:
NOT mass-inspecting anything
NOT shouting at anyone.
Building quality into the product so that you know you can trust it. Re-work becomes pretty much a thing of the past.
But how do we do #3? This is the counter-intuitive bit, that still mostly keeps Medicine stuck before 1924. Let’s address the burnt toast at the start of my post. (The image was generated by Ideogram).
Imagine you own a restaurant that does breakfast. Heck no. You do own the restaurant. There are complaints. The customers’ toast is burnt. How do you fix this? If you came from Medicine, you’d likely first shout at the staff. Then—when this inevitably failed—you’d employ a toast inspector, and a toast scraper, and a toast scraper supervisor.
But instead, being adept at the restaurant business, you’ll ask a simple question. “Why is the toast being burnt?” You may have to ask several more questions, like “Why is Gustav too busy to make sure the toast doesn’t get burnt?”, or indeed “Why is Fred slacking off so that Gustav has to do two jobs, resulting in the toast getting burnt?”, or even “Why does Fred have to work another job at night to make ends meet, so that he’s too tired to do his work in the morning?” Perhaps we can, after all, afford to pay Fred a living wage?
But eventually, you’ll find what’s wrong, and make changes to fix the process that went wrong, resulting in burnt toast. You may institute processes that check the toast from time to time (or just control the pass a bit better), to make sure that your changes have sorted out the problem. Fred is calmer now. So is Gustav. So are you. And your customers are happier.
Somehow, Medicine is considered different—and difficult. Let’s say we have limited resources in the Emergency Department (ED), so it’s crowded. The hospital is packed. The rate of hospital-acquired infections is sky-high. Everyone is stressed. Patients are dying on stretchers in ED. The ambulances are backing up. There is no extra funding. What do you do?
Goodhart’s law
A traditional “fix”—one that always fails—is to set targets. Tony Blair tried this in the UK in the noughties. He set a four-hour wait limit in EDs. And the numbers improved. People continued to die nastily, though. Why?
Because the system will continue to produce what it was ‘built’ to produce. The toast will continue to be burnt, as we haven’t changed the processes—or even asked the right questions. One of Walter Shewhart’s pupils, a chap called W Edwards Deming had an even more succinct explanation.
94% of troubles and possibilities for improvement belong to the system.
In other words, if you’re a manager, 94% of the responsibility for fixing things is in your hands. “No problem”, you say. “I’ll set targets. That’s what managers do, right?”
If you still think this, you weren’t listening. But let’s spell it out. The British economist Charles Goodhart framed the problem along these lines:
When a measure becomes a target, it ceases to be a good measure.
In other words,2 people will move Heaven and Earth to meet the target, regardless of the secondary effects. Blair’s ED targets were appropriated by the Australians. Here’s what happened in Canberra (warning: large PDF):
Having been constantly told things like “Fix the numbers”, “I don’t care if you have to go down and stand at triage yourself to make sure they are referring patients to the Walk In Centre, get it done”, “I have told the Minister that we will be at 70% of patients being seen on time by December so make sure it happens” and “Your staff are not able to do their jobs and show no leadership” I could see no way out. I kept hoping that all the initiatives we were doing to improve ED would have an effect on the performance data and that I could stop.
I did not alter the [ED Information System] data with any thought of personal or financial gain. I foolishly and stupidly did it in an attempt to protect myself and the staff who I work with. It is as simple, and as complicated, as that.
This manager—who defended her staff against impossible targets by doing the only thing she could—was fired. She should have got a medal. The people who imposed the targets as a ‘solution’ weren’t fired. They may well have been promoted. And to this day, they have likely never even heard of Goodhart’s law, which is pretty much guaranteed to play out wherever targets are set. You see, setting targets is simply what people do when they also don’t understand even the rudiments of process control. It’s diagnostic of incompetence.
Setting targets is a cowardly way of shouting at people by proxy. Shouting with numbers. So what should we do instead? We might ask how we can use the numbers better, for starters. But even before we do this, we need to do something really basic.
The first step
We science it. As I’ve explained previously, good science starts by examining the problem. You build a model. You check your model. You test your model in the real world. Often it doesn’t work—so you have to revise it, so it’s predictive (better than random chance, and better than other models).3
For example, you may find that ED is crowded because the hospital itself is full—so there’s nowhere to move patients out of ED. Desperately shoving the critically ill heart attack patient into the Ear, Nose and Throat ward isn’t going to work. So you look deeper. Why is the hospital full? Perhaps because some older people on the General Medical wards are sticking around for weeks. Why are they sticking around? Perhaps we have too few physiotherapists and occupational therapists? Or perhaps we’re having trouble placing them in rest homes or private hospitals? Now we’re talking…
But the problem is, nobody’s listening. The nurses in the ED are all weeping, because someone shouted at them, because a patient just ‘breached’ the four hour rule. The Breach Manager (aka ‘Flow Manager’) is called. Let’s find another place we can sequester the patients instead. Aha! If we designate those rooms in ED as “short stay”, they won’t be counted, so we’ll meet the target. Hooray.
There is a better way. It involves measuring what is happening, and making changes, and seeing how the measurements change, and understanding the measurements. But there’s a secondary problem here. One that Walter Shewhart pretty much solved. So let’s look at it. As always, the problem is time. Hold the following chart in your mind for a bit. We’ll get back to it.
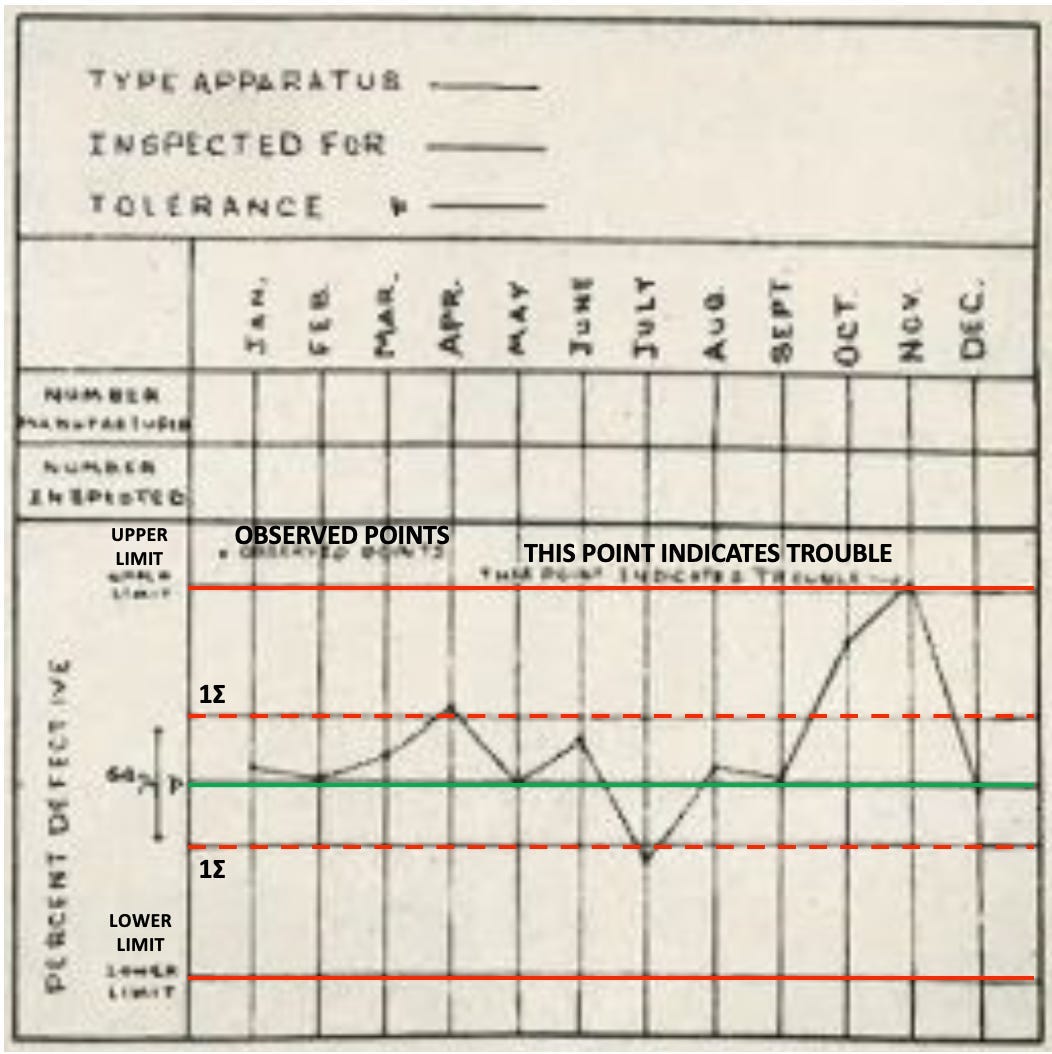
Image of the first control chart ever is from The Digestible Deming.
Time
Measuring things is easy. As we’ve previously discovered, measuring things well is a bit more challenging. Measuring things over time … Well. Er.
Honest physicists will tell you that the one thing they don’t have a handle on is time. Honest biostatisticians should freely admit they don’t either; but they will often instead talk about time series analysis.
Let’s put the real problem firmly in a medical context. Again and again I see people making changes to processes. To “show that their intervention has made a difference”, they measure before and after—and show a difference. Can you see the problem? If you take two measurements of a medical process, chances are they’ll differ. Things vary. Shit happens.
The real question here is then “How do we know when a change is ‘real’?” If I take two measurements, how do I know when one significantly differs from the other? The answer is simply, “You don’t”! You need measurements taken over time—often even counts will do; a context in which to interpret these measurements; and an approach to interpretation.
Now for that chart!
Look at that chart again. What do you see? There’s a process. It’s being measured. That’s the wiggly black line in the centre. The smart physicist who made it has also drawn in control limits. The dotted red lines run at one standard deviation (SD) on either side. If the process is varying randomly, you’d expect about two thirds of the joined-up dots to fall within this range. But what about the second red line on either side? Because this is set at ± 3 SD, well over 99% of the dots should be contained. One isn’t. As the chart so eloquently says “THIS POINT INDICATES TROUBLE”.
We have a way of teasing apart the normal bloody variation that every process undergoes, and ‘special causes’. Actually, we have a lot more. But this is the key insight, the start to understanding statistical variation, and process control. In other words, we have two different types of variation:
Common cause variation—everyday, “you’d expect it to happen” variation
Special cause variation—this is unusual, unexpected, and usually worthy of comment.
And the comment is usually in the form of a question, and that question is “Why?” This is why you need to understand the context of the measurements that were taken. If there’s a spike in admissions to ED, then “Why?” Was it the football match? If there’s an increase in the number of deaths in neonatal ICU, then “Why?” If there’s just one week where central line infections went wild, then “Why?”
Process change
There is naturally another way we can get excursions beyond the reasonable ± 3 SD bounds too. This is if the process is changing. Let’s say more elder care facilities open up in your region. What do you expect to happen to ED visits? Precisely. The line will slope up—so you’ll get more and more breaches of those bounds. This is one clue to the presence of changing processes. So we can add a third type of variation to our list:
A process change—often signalled by grouping of apparent ‘special causes’.
Next steps
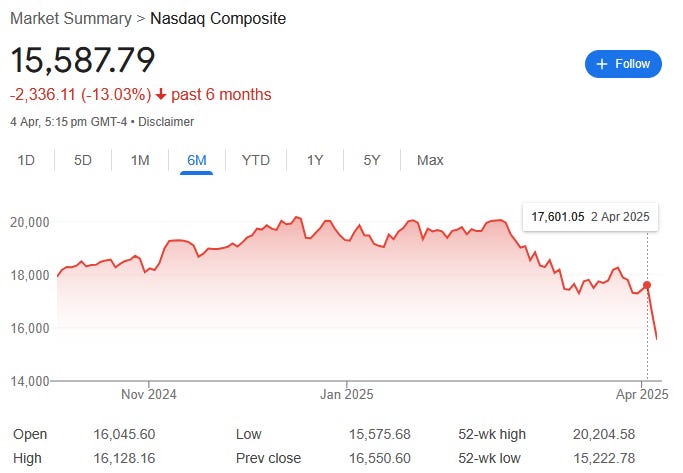
I think it’s clear that although we’ve taken our first steps in statistical quality control, there’s a lot more to do. And you should be suspicious of the glibness with which Deming pronounced “94%”; deride the facile elision I’ve just made into 3 SD bounds—without even saying how to calculate them4; and most important of all, worry about when not to use such charts (Hint: the share market).
I had intended to devote my next post to delving a bit deeper, and moving on to Deming and Japan. After that, I still want to talk about an even simpler and even more neglected way of detecting when processes change. But seeing as the Great Orange Depression seems to be upon us, perhaps I’ll devote next week’s post to a few comments on that instead. I promise my take will be different from anything else you’ll read.
Till next week, then. And don’t burn your toast in the meantime.
My 2c, Dr Jo.
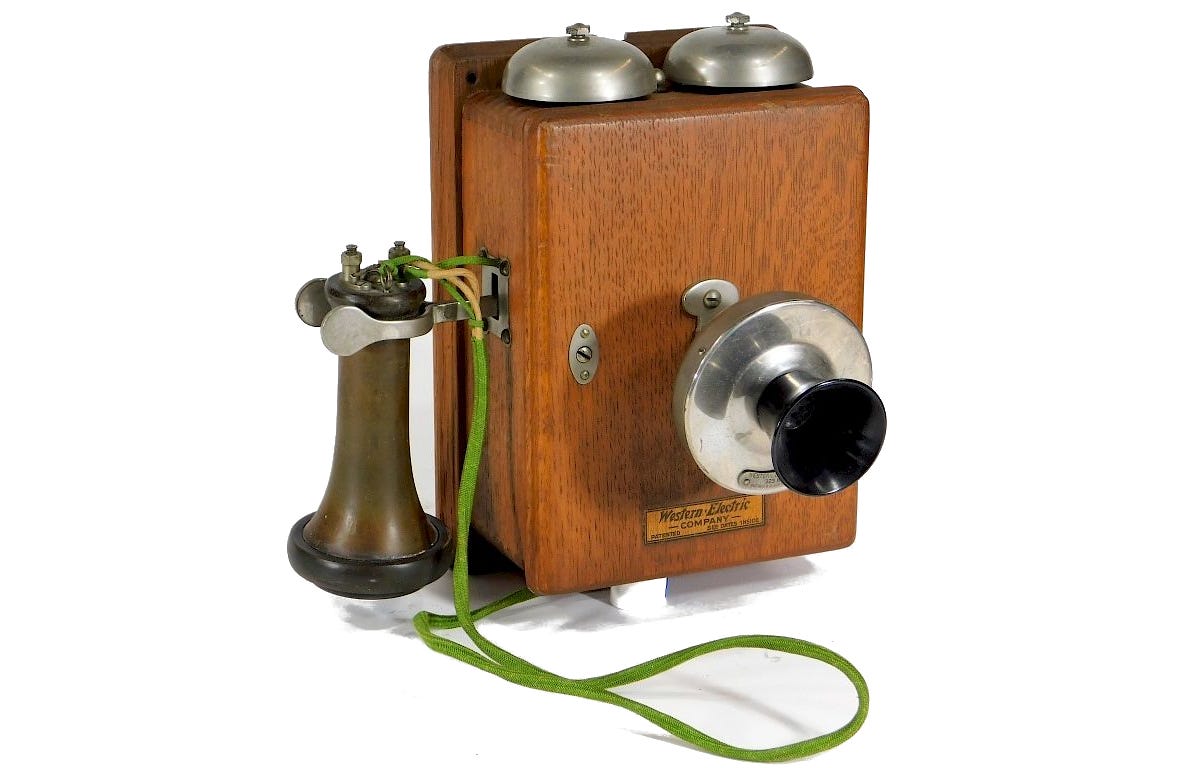
The picture is of a Western Electric 323w, likely similar to the phones Shewhart worked on.
Goodhart phrased his law as follows:
“… whenever a government seeks to rely on previously observed statistical regularity for control purposes that regularity will collapse.”
People who are into Continuous Quality Improvement will recognise that the Deming/Shewhart PDSA cycle is almost identical to my description of how good science works.
As an aside, pretty much everyone who sits down and naively tries to calculate 3SD limits on a control chart gets this wrong. It’s just one of those things.
Thanks for your thought provoking article Dr Jo. I am intimately aware of the perverse process of target setting and associated system gaming with ED wait times from 30 years in the NZ Healthcare system. There is a strong tendency for micromanagement in crises. Focus on the one or two, measurable things that might be controlled, rather than addressing the actual problems such as the availability of community geriatric rehab and aged care beds responsible for bed block which backs up ED. Short sighted targets often end up punishing those who cant control the mechanisms of effective resolution.
To me a recent concern is the micromanagement of Te Whatu Ora staffing challenges by requiring a slow and inflexible central control process of approval for clinical jobs nationally. This has effectively exacerbated the personnel recruitment issues. The only real outcome has been control of costs. A short sighted and ultimately incompetent approach that has worsened the problem it was set up to address.
As a 40+-year resident of Tokyo and a government translator during the auto tariff wars of the 1980/90s, I’m looking forward to your comments on Deming and Japan. (I’ve had several interactions with the hospital system here and in general find their processes to be quite rational.)