


When I was young, I loved two things: words and wildlife. It is natural to try to join the two up. This can get a young ‘un into a lot of confusion, but fortunately for me, the veld that extended for kilometres around our home was more alluring than ontology. We also lived in an age without helicopter parents, so could disappear into the veld for the whole day with the dogs—and if a spitting cobra bit you or blinded you with venom, well then, you jolly well should have been more careful.1
Not that this happened to my brother or myself, or indeed the dogs. My cat, who I believed was half wildcat, used to drag in all sorts of dead animals and leave them under the bed, and one of these we identified as a black-necked spitting cobra. Although now I learn we were wrong—the Mozambique spitting cobra has been split off from Naja nigricollis by eager taxonomists. It’s now Naja mossambica, beautifully illustrated in the still above, from a Living Zoology video on YouTube that has the added bonus of lacking a vocal commentary other than birdsong.
I have this strong suspicion that Aristotle (who really kicked off the Western fixation with ontology) would have seen things a bit differently had he lived in Africa. The world would be a better place had he spent more time avoiding cobras, and less time making boxy classification systems. We’ll get back to Aristotle in due course, but now that I’m older and don’t live in Africa anymore, I’m drawn to spitting cobras as a fine illustration of concepts like accuracy, precision and bias, possibly because they’re more exciting to me than drawings of targets with bullet holes in them. Although we’ll likely succumb to that later. Some conventions are too hard to shake.
A tale of three cobras
Spitting venom is such an advantage that snakes appear to have evolved it three times, separately. Some Asian cobras have it; African spitting cobras obviously can spit copiously and with enthusiasm; and then we have the rinkhals, which merely looks like a cobra—but can also spit venom.
Venom on your skin does nothing; a tiny drop has to get onto the cornea of your eye, where it hurts like the dickens. Unsurprisingly, scientists have studied how the snake does this, and it turns out to be even more special than you might imagine. The venom is ejected in about 50 milliseconds, so the snake can’t watch the venom trajectory. The fangs are also effectively stationary in the jaw, and the target can be several metres away. It’s a wonder that any venom ever gets into eyes, but it does with distressing frequency. How does the snake do this?
First up, it oscillates its head both vertically and horizontally, increasing the dispersion of the venom. This isn’t enough, though. In 2010, Guido Westhoff and colleagues measured how it all works. Their commentary can be quite engaging:
Since the object being moved (the last author's head) was a constant; we recorded acceleration data synchronized to 500 frames s−1 video sequences (see below) of movement against a known scale and used this data as a calibration to enable conversion of the kinematic data from acceleration to linear displacement.
They looked at correlation between the head wiggles of the author, and those of the cobra—and found that the cobra tracked the target very well. In 35 of 38 trials, the cobra’s head was moving in the same direction as the target’s head when it started to squirt venom. Here’s their Figure 6:
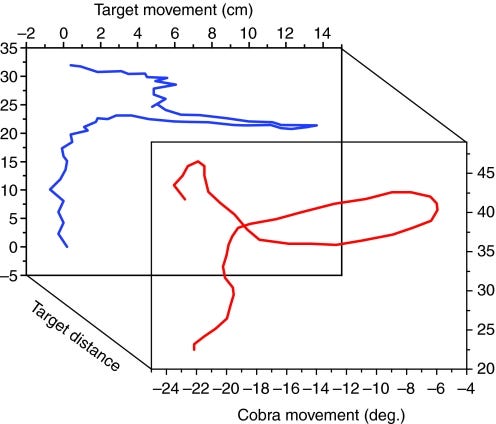
In blue at the back we have movement of the last author’s head; in the front, the two dimensional, sympathetic movement of the snake’s head. They even managed to record the reaction time of the cobra, about 200 milliseconds, which is similar to that of humans.2
The takeaway seems to be “Don’t wiggle your head when confronted by a spitting cobra”. That, and—if you read the footnote—“Don’t unthinkingly trust early ‘psychological’ studies, especially where the full data aren’t available. They may be subject to bias.”
Measurement and accuracy
We humans measure all the time. In fact, it’s difficult to imagine a real-world scenario where some form of measurement is utterly absent. Our measurements can be formal, and calibrated, for example where a false start is declared because the sprinter appeared to react in under 100 milliseconds; or hugely informal, more like the ‘guesstimates’ we use all the time in everyday life. How tall was the man who took your purse? His hair was brown, but what shade of brown?
When we’re deciding whether we’re at a safe distance from a threat, or estimating how far a baseball flew, or working out how much a cobra’s head oscillated, in one way or another, we’re measuring.
Let’s now look at some properties of measurement. You’d think that I’ve already done this to death in my earlier post on measurement, but there’s a lot more ground to cover. Reading the Wikipedia article on the black-necked spitting cobra, one of the several current inaccuracies is this unreferenced statement:
[T]hey can eject venom from their fangs when threatened (one drop over 7 metres (23 ft) and more in perfect accuracy)
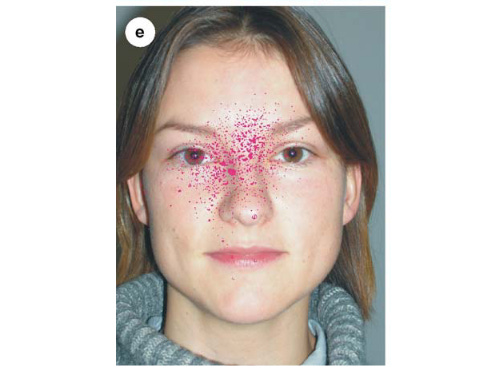
Do you buy this? What is perfect accuracy? When studied by Westhoff et al. (again) two species of spitting cobra seem to go for the centre of the face, regardless of things like eye spacing, or even the absence of one eye. And at close range, they are blindingly accurate in positioning their venom around a point in the centre of the face.3
We already know that these snakes wiggle their heads in a way that increases the spread of the venom, so a lot of the venom will get wasted, in other words the snake is imprecise in its targeting. Conversely, if all the venom consistently went into one eye, well, that’s not just accurate (on target) but also very precise—closely grouped. And biologically implausible.
It’s also clear that something can be precise, but still in the wrong place. We’re looking at some sort of average displacement that’s offset (biased) from where it should be. Inaccurate. In the common metaphor, the bullet holes are tightly grouped, but away from the centre of the target—a bias. But how do we actually measure this?
Some Bland observations
I never met Douglas Altman, and now regrettably never will, because he died in 2018 from bowel cancer. A bit more than a decade ago though, I was lucky enough to attend a series of lectures at Auckland University by his long-time pal and co-author, Martin Bland. I remember this for three reasons—I made an arse of myself by saying something daft about “last observation carried forward”, and Martin was unfailingly polite; I engaged in a long discussion with an Eastern European statistician who had flown halfway round the world just to listen to Martin—and who was like me blown away by how effortlessly and clearly Martin made difficult topics easy, and others made them difficult; and finally, Martin mentioned two of Altman’s rules to live by. These were “Don’t ever make a presentation you’ll only use once” and “If you’re going to bother to study something at all, make it publication quality”. I’ve embraced the first, and think of this second rule whenever someone approaches me for medical data, and says “I just want to do a quick in-house audit”.
The preceding paragraph may seem like a non-sequitur. Three small things though. Writing together, Douglas Altman and Martin Bland have the most cited paper in each of six different journals (one of them the Lancet); secondly Douglas has a Hirsch index4 of 274—an astronomical value. Martin’s is 86. They are heavy hitters in the statistical literature. They have Proof of Work.
However, we haven’t yet mentioned that third, small thing. The charm. That highly-cited paper from the 1986 Lancet, with tens of thousands of citations:
STATISTICAL METHODS FOR ASSESSING AGREEMENT BETWEEN TWO METHODS OF CLINICAL MEASUREMENT. J. Martin Bland, Douglas G. Altman
This may seem a bit dry. It’s bloody well not! The paper is a doozy. It tells us how to compare measurements well.5 It also explains bias.
An antidote to correlation
The traditional way to compare two things is correlation. When trying to assess whether two measurements agree—or how biased one is relative to the other—correlation is often frankly misleading. In their paper, Altman & Bland show how we can do better. Simply.
The trick is to take the individual measurement pairs, and do two things: find their difference, and their average. Then, plot the two against one another: the difference on the Y axis, and the average on the X axis. We can then establish limits of agreement. We can learn a lot from the shape of the plot. And we can do at least one other thing, shown nicely in this recent exploration of Bland-Altman analysis:
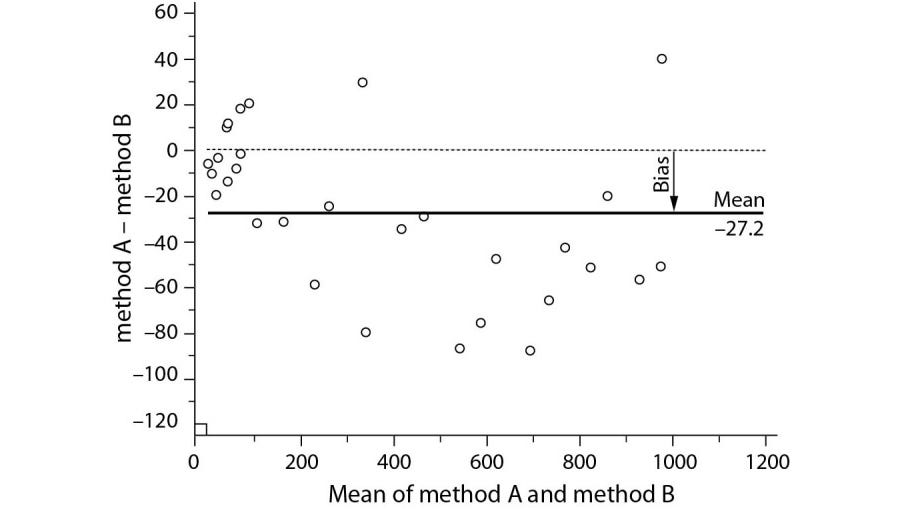
Can you see the bias? We have a simple measure of bias! But this is fairly specific. What about bias more generally? Let’s talk types of bias. For this, we’ll need to explore how we classify things—taxonomy.
First, taxonomy
As I cautioned at the start, we need to be careful with classification. Historically, the “study of the way things are” has been called ‘ontology’. The problem with this is that it’s like exobiology—there’s nothing to study! We’ve already worked out there’s no way we can determine the way things really are, even asymptotically. All our measurements are predicated on theory, which is always just provisional until a better theory comes along. At least with exobiology someday we may have data. Perhaps more sensible is taxonomy then: provisional structures with a sprinkling of names.
Strangely enough, although Aristotle was not a fan of Plato’s “forms and ideals”, he was nevertheless big on ontology. He also followed the natural tendency of descendants of tree-dwelling apes to think in terms of trunks, branches, sub-branches and so on. We’ve carried on this tendency over the next couple of millennia.
I find that when people are bewildered by the world, they often resort to taxonomy. Cardiologists, who still don’t understand why some people with furred up coronary arteries get heart attacks but others don’t, resort to sub-classifying heart attacks into various types instead of finding out why some plaques are inflamed, and others aren’t. Lung experts who are puzzled by something like ‘interstitial lung disease’, will classify, classify, classify — and then speak authoritatively about ‘idiopathic interstitial pneumonia’ as if they now know more, simply because they have a taxonomy.6
Taxonomists come in two types (Did you see what I did there?) — ‘lumpers’ and ‘splitters’. The former tend to bother more about broader groups; their polar opposite is people who agonize over every last detail, and are given to classification, and sub-classification, and sub-sub-classification—and more, if they can get away with it. Lumpers will see one type of spitting cobra; splitters will create a whole cobra tree.
I suspect that if I’d spent more time as a child worrying about the relationships between words, and types of animal, I’d be a splitter. I’m instead more keen on broad relationships. This may represent a substantial bias. But anyway, here are my hints on how to avoid being enervated (or even envenomated) by a taxonomy:
Look for weasel words: from a recent footnote, we know that ‘essential’ and ‘primary’ are words that mean “I don’t actually know”. Some taxonomies are similarly designed to confuse rather than enlighten.
Always ask what a term means—and add as many follow-up questions as are needed to make sure you’re talking about the same thing.
Ask about the model. Understand the model. Where does the term fit?
Science It! Is the model coherent? Does it work in the real world? Or is this some sort of Platonic abstraction?
Ask what is outside the taxonomy.
It turns out that some taxonomic splitting is useful. For example, the black-necked spitting cobra is not only genetically different from the Mozambique spitting cobra and the western barred spitting cobra (Naja nigricincta) but they live in different habitats and have different habits.7 Their venom also differs so if, for example, you are bitten by N nigricincta, conventional polyvalent antivenin may not counteract the venom, which does work against N mossambica.8
Sometimes lumpers are useful, and sometimes splitters. Used well, taxonomy can aid both communication and action.
A double take
Are you now tired? I am. But as I wrote, something struck me at this point. A question:
What’s the difference between bias and a systematic error?
I find this really tricky. What do you think? I suspect the problem is that we use the word ‘bias’ in two ways.
A taxonomy of bias
Bias is complex. If I look at most dictionary definitions, they incorporate some reference to ‘fairness’, however it’s used. In other words, we have some reference point—and the bias is an identifiable deviation from this. In this sense, the bias is a systematic error.
But the word ‘bias’ is used in another way. Above, I said that my tendency to favour broad relationships may be a form of bias. This suggests that ‘bias’ may contribute to an unwanted outcome. It may move my hand. An error is not there yet, and perhaps not even measurable.
In this sense, bias lurks in the shadows. It’s imponderable—quite the opposite of a measurable bias. How do we resolve this? One way is simply to wait and see. If I think someone has ‘gender bias’, well then, wait and watch the numbers. But why did I think this in the first place? Quite often, if I look carefully, I will discover one or two things—either I’ve misinterpreted the data, and the bias is mine; or there is measurable evidence of bias! We have another strength here, too.
Within my past posts we already have a framework within which we can interpret differences—Science. We can establish reference points, and measure with respect to them. We understand how measurement works, the common ground we share as people, and even why we should ‘play nicely’. We have even started to evaluate entire systems and criticise how they function—first from the perspectives of Shewhart and later Deming, and then in terms of sensible economics, which powerfully determine things like health, things that are important to us.
In that last post I mentioned bias several times. I spoke of my own bias against economists, which we found to be unfair. An error! I mentioned how I might be guilty of ‘selection bias’ in focusing on certain show-pony economists; I briefly referred to “perceptual bias”, “hindsight bias”, and “attribute substitution”, all of which seem to fit that second meaning of ‘bias’ as an imputation of latent error.
Splitters don’t make bias easier here. They make long lists. There is a Catalogue of Bias on the Web with 49 named biases.9 Chavalarias and Ioannidis found 235 of them. With taxonomy we even have “taxonomic bias”! It can all be a bit overwhelming.
Practical bias, then
So what we really need is a practical approach to bias. Here’s one:
Ask whether the ‘bias’ being referred to is measurable against a reference standard. This can now be interpreted as a systematic error.
Otherwise, determine whether the ‘bias’ refers to an assumed tendency of something or someone to deviate from achieving a desired outcome. A prediction. It may be reasonable to test that prediction—or simply look at the existing data about past performance.
Be aware at all times that even our processes for evaluating bias may themselves be ‘biased’ in that second sense! Bias can hide in multiple layers.
Throughout, I think it’s important to remember that at the centre is accuracy—we’re allowed to be imprecise. The second way we see bias also invites us to explain human bias. Why should we deviate from reason?
A lot of our aberrant behaviour seems to be due to defects in our internal model of the world: the availability heuristic (giving rise to attention and hindsight biases); how we feel about something (affect); belief that our model is representative based on incomplete or inaccurate evidence, flaws in framing or loss aversion; familiarity; excessive optimism; and perhaps most profound of all, the influence of those around us. We are extensively conditioned by the system.
I’ve fortunately managed to avoid artificial intelligence and how it ties in with biases, which I will leave for another post. Not the next, though! Fresh from the topic of bias and its interpretation, I still need to get something off my chest. It concerns league tables, the topic of my next post.
My 2c, Dr Jo.
We were ignorant and carefree then. In reality, snakebite is a major and neglected cause of death in both Africa and Asia. Despite this, most snakes only want to escape; many spitting cobras will also ‘play dead’ if needed.
Well, most humans. Measurement of reaction times was popularised by Hugh Fullerton’s praise-filled, dodgy and rather informal 1921 study of Babe Ruth’s reaction time and other skills, but people had already been measuring them for decades. It also turns out that while human reactions to visual stimuli generally occur in about 200 ms, we’re quicker with hearing. Some elite sprinters can react to the starter’s gun in just 110–120 ms. Conversely, where substantial cognition is involved, we need even more time.
This is artificial colorisation of the venom distribution, of course.
If you’ve not come across the h-index before, it’s the maximum value h, such that the author has published at least h papers that have been cited h times. A really top-class author after decades of striving may achieve an h-index of about 40. But the Hirsch index is both Proof of Work, and a curse. The curse part is because of Goodhart’s law, which we’ve explored before—anything that becomes a target is immediately gamed.
A Bland-Altman plot is widely claimed to be identical to a “Tukey mean-difference plot” cf. NIST ... but the origins seem obscure. William Cleveland describes the latter in his 1993 book Visualizing Data (p 22) but doesn’t provide a reference. It’s not in Tukey’s 1977 Exploratory Data Analysis, nor in his son’s Graphical Methods for Data Analysis, 1983, pp 48–57, despite the NIST reference. I think this ‘identity’ is made up!
Medicine may be unique in the way it’s invented ways of hiding the phrase “I don’t know what’s going on here”. We have terms like ‘essential’, ‘primary’ and ‘idiopathic’, but also ‘cryptogenic’, ‘functional’, ‘non-specific’, ‘syndromic’, ‘atypical’, ‘reactive’, ‘constitutional’, and ‘multifactorial’. In addition, we’ll often speculate about autoimmune or viral or psychiatric causes, without putting any meat on the bones—or even having much of a skeleton to start with. This approach is nicely satirised (together with out penchant for acronyms) in a tiny note in the British Medical Journal from 1979, where Dr W Alan Heaton-Ward describes ‘ATALOIA fever’. I won’t spoil it for you.
N. mossambica is even happy to make a meal of the feared black mamba!
Excellent preliminary news is that research into blood samples from Timothy Friede, who immunised himself using repeated injections of venom and bites from potentially lethal snakes, has allowed us to identify common motifs in most snake venom, with the potential for a new, near-universal three-component antivenin. This may be some years away.
A litany of biases here in the Apple Heart Study.
I think if I read this thrice more my barely measurable hangover will simply disappear.
“Sometimes lumpers are useful, and sometimes splitters.”
This reminds me of Alexei Panshin’s 1968 novel, “Rite of Passage,” and the plot element of synthesists and ordinologists. A synthesist “know(s) a little about everything and see(s) enough to put the pieces together.” They can take something from this rea and something else from that area, and third thing from yet another area, and put them together in a new way. A kind of lumper, if you will. Ordinologists do what it says on the tin—put things in order. They organize separate kinds of knowledge. They are a type of splitter.