Procrustean Water Torture
Statisticians don’t like Alzheimer result, invent new Universe in which to do analysis


One of my favourite scenes from Terry Pratchett’s Guards! Guards! involves the firm belief of those same guards that “Last, desperate million-to-one chances always work”. There is a problem though …
‘So it’d only work if it’s your actual million-to-one chance,’ said the sergeant.
‘I suppose that’s right,’ said Nobby.
‘So 999,943-to-one, for example—’ Colon began.
Carrot shook his head. ‘Wouldn’t have a hope. No one ever said “It’s a 999,943-to-one-chance, but it just might work.”’
They stared out across the city in the silence of ferocious mental calculation.
They end up with Colon standing on one leg with his tongue sticking out and soot on his face, singing The Hedgehog Song, under the premise that this will adjust his odds of hitting the dragon with his lucky arrow to precisely a million-to-one. Let’s meet some statisticians who think similarly. But first …
A recap
Previously we encountered⌘ Sylvain Lesné, who thanks to his extraordinary Photoshop skills seems to have been more than equal to the task of subduing his western blots, and convincing them that they showed the mysterious, snark-like ‘Aβ*56’, a peptide that has not been seen before or indeed subsequently. According to Google Scholar, his paper has been cited 3643 times. The prestigious journal Nature will still try to sell it to you for a cheeky €39,95—despite the fact that they were forced to withdraw the paper 18 years later.
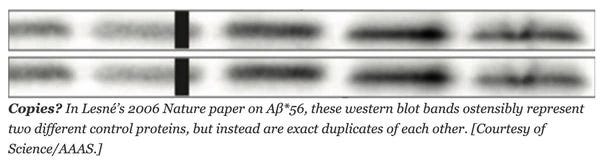
There is a multitude of reasons for the withdrawal. Enthusiastic pursuers of truth can read a blow-by-blow account on PubPeer. Above is an example from the article’s obituary in Science. There are many such defects, some that show the straight edges characteristic of cut-and-paste. Next a bit of Greek mythology, for context.
Procrustes
Procrustes was a rather grumpy innkeeper on the road between Athens and the sacred grove at Eleusis. His inn had but one bed, and if you didn’t fit, you were in for an exciting time. Too long, and he chopped bits off, too short and you were stretched on the rack.
Today we have procrustean data torture. In a paper in the New England Journal of Medicine from 1993, James L Mills used this term for the application of multiple statistical tests until one fits. We’ll look at a recent, egregious example, but first, a drug we’ve met before⌘: aducanumab.
You may recall the multi-armed statisticians, each arm furnished with a statistical test. Two years after two trials of aducanumab were abandoned for futility, they convinced the FDA to convene a committee of experts to evaluate their statistical claims that, after all, one of the trials was positive. The committee told them to take a hike, at which point—in rapid succession—FDA neuroscience director Billy Dunn overruled the experts, released the drug for general use against Alzheimer’s (at a cost of about $100,000 per year), resigned and went to work for a pharmaceutical company that specialises in neurodegenerative diseases.1
Biogen rapidly abandoned the drug (It failed to sell) and instead focused on lecanemab, another amyloid-sucking antibody. You’ll recall it does this sort of thing:
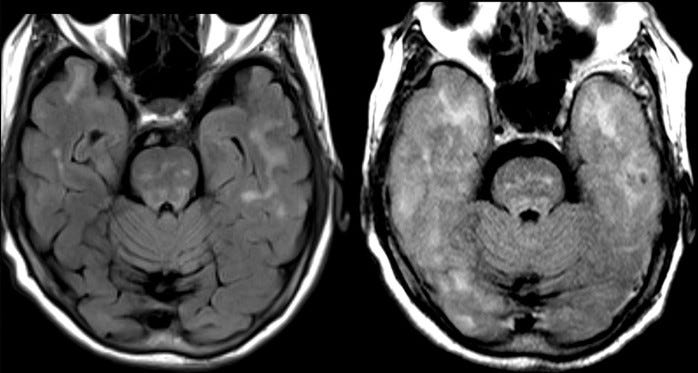
What’s a bit of potentially lethal brain swelling and bleeding if the progression of your early dementia can be shown statistically to drop by a minuscule amount, and three deaths can be brushed aside? (The woman imaged above died).
Now, after some time we have … Tadaaa!
Procrustean Water Torture
I just invented the term. The statistical approach is also recent. The idea is that in the traditional form of water torture, you were driven crazy by an intermittent drop of water falling on your head. Here, we combine the excruciating delays and repetitive antic-i-pa-tion of dribbling out new analyses of old data with all the fun of statistical stretching and limb hacking.
It’s difficult to get away with this using conventional statistics, but it seems that if you pay statisticians well enough they can be quite creative. New set of rules, in a new Universe, where million-to-one chances happen nine times out of ten? No problem.
Two years after the TRAILBLAZER-ALZ 2 trial wormed its way into JAMA, the following paper dribbled into JAMA Neurology 2025;82(12):1251–1256: Posttreatment Amyloid Levels and Clinical Outcomes Following Donanemab for Early Symptomatic Alzheimer Disease. A Secondary Analysis of the TRAILBLAZER-ALZ 2 Randomized Clinical Trial. Written by Ming Lu et al, working in close co-operation with Eli Lilly and Company.2
This is a “post hoc exploratory analysis” where they categorised participants into deciles and correlated this with changes in outcome scores. They claim:
… a correlation between posttreatment amyloid plaque level and clinical benefit [supports] amyloid plaque removal as the mechanism of action for donanemab treatment …
Here’s their figure 2:
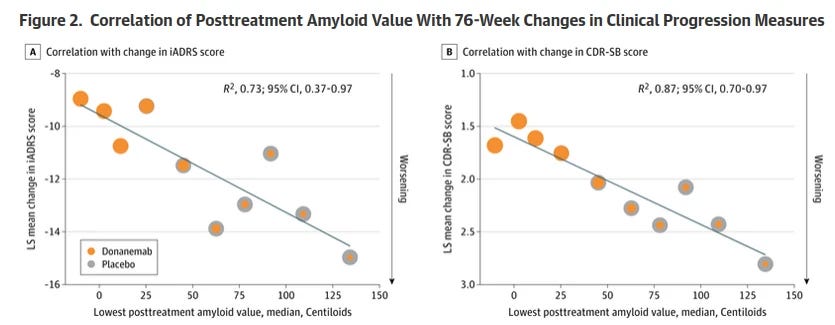
See: pretty dots. Slopes. Correlation. Causation from correlation. Hooray.
Hey slow down, you drip too fast
Not so fast! Just a few days ago, this letter popped up in JAMA Neurology: Methodological Considerations for Quantile Aggregation in Alzheimer Disease Trials.
It’s written by an epidemiologist from Brown University, neurologists and experts on ageing.3 I think this is a damn good paper. They simply point out that by regrouping participants in quantiles according to post-treatment amyloid burden, the authors break the whole foundation of prospective randomisation.
They also show in two different ways that the above pretty graphics are an artefact. First they use simulated data; then they use publicly available real data. Here’s their Figure 1.
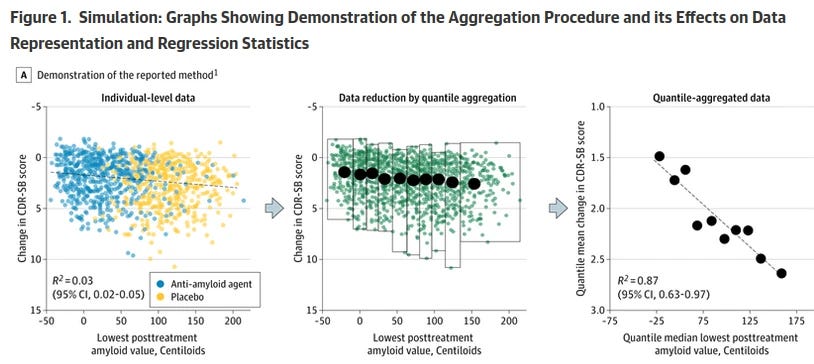
On the left, we have the pure, randomised data, R2 = 0.03. When you mix them up, you get a nice slope R2=0.87. The same thing happens when they use actual clinical data from a negative study of solaneuzumab—remarkably, the R2 goes from 0.04 to 0.99. If you mess up the data, your random arrow can hit any dragon you want. There’s more discussion here if you’re interested.
The final nail?
I doubt these chaps will stop punting these drugs simply because they don’t work. Nor will they stop promoting them because they cause manifest harm. Nor will new analyses stop dribbling out like the micturition of an elderly and incontinent Lesné mouse. They may stop if enough people start calling them out. Notable is the very recent analysis (16 April 2026) in the Cochrane Library, by Francesco Nonino and colleagues. I think we should end off with their full conclusion:
The effect of amyloid‐beta‐targeting monoclonal antibodies on cognitive function and dementia severity at 18 months in people with mild cognitive impairment or mild dementia due to Alzheimer’s disease is trivial, while on functional ability, it is small at best. Amyloid‐beta‐targeting monoclonal antibodies increase the risk of amyloid‐related imaging abnormalities. Both desirable outcomes and adverse events were inconsistently reported in the studies included in the review.
Successful removal of amyloid from the brain does not seem to be associated with clinically meaningful effects in people with mild cognitive impairment or mild dementia due to Alzheimer’s disease. Future research on disease‐modifying treatments for Alzheimer’s disease should focus on other mechanisms of action.
I can’t imagine a Universe in which I’d prescribe these drugs. Even if it contains threatening, fire-breathing dragons, or worse still, relentlessly persistent statisticians hell-bent on not just beating the odds, but manufacturing them.
My 2c, Dr Jo.
⌘ This symbol is used to indicate posts where I’ve discussed the flagged topic in more detail.
The resemblance of this piece’s subtitle to something from The Onion is quite deliberate.
I even predicted the hop, skip and jump before it happened.
Seeing as all of the authors are employees, apart from David S Knopman from the Mayo.
None of them potentially indebted to Eli Lilly, apart from Dr Lon Schneider who reported grants from Eli Lilly, Eisai and Biogen.
This item 'may' pertain to me, but is Way over my head. But thanks for the shrouded Rocky Horror reference. Gave yourself away. (...pation)
The pair of them both look pretty embarrassing to me.
When you think about taking action to solve a problem, you have four questions. (1) How _much_ will it help? (2) How _reliably_ will it help? (3) How sure am I that I didn't just fool myself? (4) What are we even measuring?
Question number one is a question of effect size. Question number two is a question of variance explained. And question number three is a question of p-value, confidence interval, log odds ratio, and more esoteric things that statisticians get very animated about before going to war with pitchfork and torches about frequentist vs. Bayesian interpretations.
R^2 is a measure of variance explained. It's asking about reliability. And, indeed, your deciles are quite reliably correlated with CDR. For doctors treating deciles (in this case, a "decile" is a group of ~160 people), this is good news! You have found something that reveals a relationship between two variables. Unfortunately, while you know the drug changes one variable, you _don't_ know that the drug application preserves the relationship. But, anyway, reducing noise is _exactly how block averaging works_.
But let's ask: is it _true_ that there's a relationship? If we look at the unbinned data, the CI on the R^2 value is 0.02-0.05. That means _R^2 is not random in the original_. (And, since the original analysis showed a small significant effect, that's what you'd suspect, though there are ways it could not come out that way). In the reanalysis, it is 0.7-0.97. Still significant! Significance doesn't tell you how big, though! So the binning didn't change the significance conclusion.
Now let's ask how big the average effect is by looking at the average spread in amyloid levels. If you just eyeball it, amyloid levels vary on average by maybe 50-75. That corresponds to an improvement of about 0.5 points, maybe a bit more, according to the decile table. And if you try to eyeball the full graph, lo and behold you get about 0.5 points, maybe a bit more. The reanalysis did not change the effect size!
Now, this doesn't tell you whether the drug did anything, because the analysis throws away labels (that's what we're actually measuring here). This was genuinely dumb (or diabolical) of the reanalysis paper. The underlying relationship could have a negative slope, the drug could keep the same relationship but push the population left on the X-axis, and you'd have a completely useless drug that, if you forgot you threw away your labels, would have a Simpson's paradox-like structure. And the reply paper mentioned in text that something could happen but _didn't provide a clear demonstration_. (It is trivial to demonstrate, like with the R^2-binning!) In this case, in fact, it didn't seem to happen (the original paper _already showed a small effect_, roughly consistent). And the reply paper either didn't notice or didn't deign to note that in fact, in this case, despite it being a stupid thing to do, it wasn't actually a problem.
The entire affair seems incredibly embarrassing. That the reanalysis was published at all, despite being a classic invitation to Simpson's paradox and failing to answer the critical question of whether the drug was beneficial OR whether amyloid predicts decline rates because the two were scrambled together, speaks poorly of the review process. (There are statistical methods to unscramble them.) That the reply didn't even _demonstrate that effect_, and instead focused on the statistical trivia that if you pour patients into differently-shaped cups, even though the noise level is different, the total amount of water (effect size / significance) is the same. And the conclusion wasn't "so don't fret about the shape of your cups, just keep it in mind". No--it was that oh, how dare you, because we love our R^2 to be corrupted by all the confounds it normally is like difference between clinical outcome and assessment variable, measurement noise, and so on, but not changes due to batching!
This is in a journal with an impact factor of 24.
I'm quite appalled.